Thao Nhi Radik, M.S.
Hello there,
My name is Nhi
Welcome to my portfolio - Project 1.
In this project, I will show you how I clean, organize and analyze my data. I will use different sources and data to address stakeholders' concerns.
I will walk you through my train of thought and how I show this problem.
Hard skills: Advanced Excel (Pivot table and Vlookup), Spreadsheet, CVS, Quantitative data, Qualitative data, Survey, and Tableau
Soft skills: Data visualization, Critical thinking, Problem-solving, and Communication.

Project 1: Preparing for flu seasons - part 1
The United States has flu season, and more people suffer from the flu than usual. Some people, particularly those in vulnerable populations, develop severe complications and are hospitalized. Hospitals and clinics reach their max capacities and need additional temporary staff.
Stakeholder Quotes
Patient: "I just moved to New York this year, and flu season is so much worse here; I am worried that my kids will get sick"
Physician in Florida: “We see a big difference in the number of deaths between states, especially here in Florida; there are a lot of elderly patients who need urgent care during influenza season. There is much be something wrong here".
Influenza Patient in California: "I should move to Alaska; so many people are dying here, and no one died there. They must have good healthcare"
Hospital Administrator: " We need to devise a plan to utilize all available resources and minimize understaffing and overstaffing across states by sending staff away. It might help reduce the number of deaths".
As an analyst, I will communicate with stakeholders about their concerns, try to answer each question, and come up with a plan.
First, I want to identify when flu season is. I collected data from the CDC website about the number of deaths each year from influenza.
As a data analyst, it is important to check data integrity (accuracy and consistency). First, I take a look, clean, and organize the data. Check my edited version to see how I cleaned it.
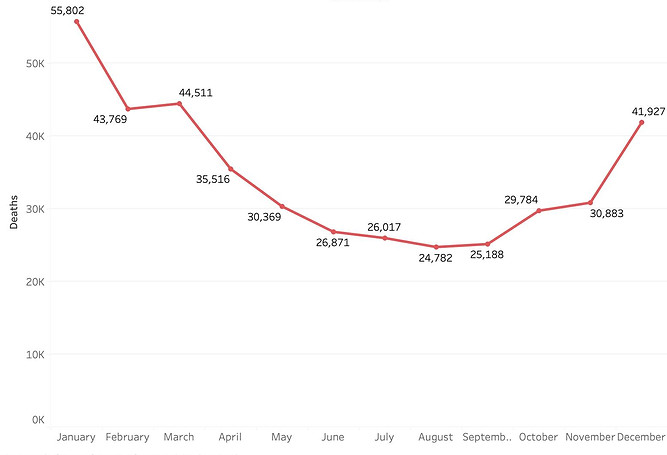
Next, I want to know when flu season is by creating a line graph using Tableau.
The data shows that from December - March of each year, there is a significant increase in the number of deaths from the influenza-flu season across the United States.
It suggests a need for medical staff around December - March of each year. We need to create a plan to send staff, but another question has arisen. Which state do we need to send people to?
I created a map that reflects the number of people who die from influenza in different states.
The United States map reflect the numbers of people who die from influenza in different states from 2009 - 2017

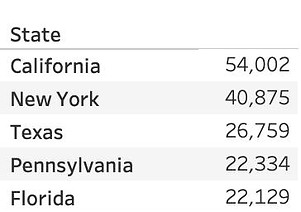
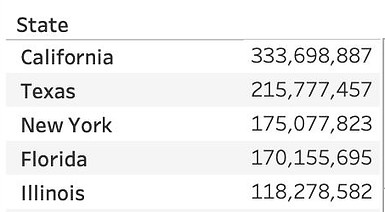
Top 5 states have highest number of deaths from influenza from 2009- 2017

Top 5 states have lowest number of deaths from influenza from 2009- 2017
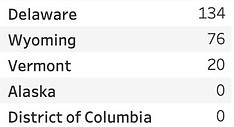
The data shows that California, New York, and Texas are the top 3 states with the highest number of people dying from influenza from 2009 - 2017. While Vermont, Alaska, and the District of Columbia have the lowest number of deaths from the flu.
It is important to create a plan that utilizes all available staff from other states without necessitating additional resources and wasting staff across the United States.
At the same time, vulnerable populations suffer the most severe impacts from the flu and are the most likely to end up in the hospital. We need to prioritize the states with large vulnerable people. Consider categorizing each state as low-, medium-, or high-need based on its vulnerable population count.
I want to know which state we need to prioritize and what the vulnerable populations are.

I created a bar graph to show who gets most affected during flu season.
The data shows that people over 75 are more vulnerable and require intensive care.
Especially people older than 85, the number of people older than 85 + who die from flu is exceptionally high compared with younger people. It is important to find a solution to bring this number down. In addition, I noticed that the flu did not affect the age groups from <1 to 24.
Next, I want to find out which states have the largest population of people who are over 75.
I need a different data set to answer this question. I found the data set from the CDC that provided the total population of each state based on age.
Compared the edited version to see how I tranform CSV file to Excel and clean it.
Top 5 states have the highest number of people over 75 years old.
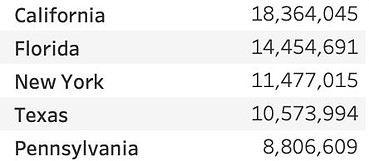
I found that California, Florida, and New York have the largest population of people over 75 years old. It indicated that we must send more staff to these states to fill the need during flu season.
For far, we know that children are less affected by the flu, and Florida has higher death rates because there are many retirement communities, and the flu causes more harm to people over 75 years old.
I answered 2 of the questions stakeholders. There are 2 more to go.
So now, we know we must send staff to California, Floria, New York, Texas, and Pennsylvania during flu seasons from December to March each year. But the next question is...
How many should we send, and from which state?
We know Vermont, Alaska, and the District of Columbia have the lowest number of deaths from the flu.
However, it does not mean we can send medical staff from other states during flu seasons since more factors are involved.
The map below reflects the population of each state in the United States.


It indicates that the states have the lowest amount of deaths during flu season because they have a small population, not because they are overstaffed
Some states have a limited number of nurses, physicians, and doctors. Even though the number of people dying from influenza is smaller than in other states, we can not send all staff out.
We need to consider what determines understaffed and overstaffed. In a healthcare setting, understaffed if the staff-to-patient ratio is lower than 90% of the required ratio, while overstaffed if the staff-to-patient ratio is greater than 110%.
I want to know the number of active physicians in different states across the United States. I dug into a third-party resource called "Statista." They show the number of active physicians in all the states. I found that California, New York, Texas, Florida, Pennsylvania, and Illinois have the highest number of active physicians. These states also have the highest number of deaths during flu season. It confirmed my observation that the states have the highest amount of deaths during flu season because they have the highest population with the most vulnerable people, not because they are understaffed.
The top 10 states have the highest number of active physicians.

I also found a strong positive correlation between the number of deaths and the total population of different states across the United States.
The top 10 states have the lowest number of active physicians.

Sources: https://www.statista.com/statistics/186269/total-active-physicians-in-the-us/
Even if they are understaffed, we can not send the staff from the states with the lowest number of deaths from influenza, such as Wyoming, Alaska, and Vermont. These states are in the top 10 states with the lowest number of active physicians across the United States.
So the next question is, what do we do?
Our goal is to utilize all available resources and minimize understaffing and overstaffing across states by sending staff away staff during flu season to reduce the number of deaths. But now we can not send them out. Even though I answered all the questions of the stakeholder, I will need to come up with a solution to solve this problem, which is my main goal.
As a data analyst, it is important to know when we hit a dead end and find different solutions around it. And my job is to answer it. If you want to know more, follow me, and I will tell you.
Preparing for flu seasons (Part 2) - What can we learn from history?
Human could lie but history never lies
Top 5 states have the highest number of deaths from influenza from 2009- 2017
Top 5 states have the largest population in the
United states
Texas is the second state with the largest population in the United States after California. However, the data showed that, over the year, New York is the second state to have the highest number of influenza deaths. New York has more than 13,000 deaths from influenza from 2009-2017 compared to Texas.
How did people in Texas decrease the number of deaths from influenza?
We know people older than 75 years old are likely to get affected by the flu. However, there is no significant difference when we look at the number of people older than 75 years old between New York and Texas.

Top 5 states have the highest number of people over 75 years old.
It suggests there are more factors that help to decrease the number of deaths from influenza in Texas each year.
And I want to know why...
I look at the number of children who got vaccinated each year from 2009- 2017 in each state.
Source: CDC
In order to work with qualitative data, the first step is to understand it and transform it into quantitative data. Open the excel sheet below to see how I clean, organize and transform qualitative data into quantitative data.
Number of Vaccinated children in each state

The data shows that Texas has the highest number of vaccinated children, while there is no data about the number of vaccinated children in Florida.
It could be a reason that leads to a high number of deaths from the flu in Florida each year.
Even though no actual data indicates the number of total people who got vaccinated in each state, it suggests that vaccination plays an important role in decreasing the number of death during flu seasons.
Conclusion
Flu season is from December - March each year. People who are older than 75 years old are more vulnerable during this period compared to younger people. Even though there is a strong correlation between the total population and the number of deaths, more factors are involved. So far, I have found that Texas has the highest number of vaccinated children in the United States, which could be a reason for the decreased number of deaths in Texas. Even though children are less likely to get affected by the flu viruses, they are still the virus carriers.
Solution for this problem: Since vaccination is one factor that could decrease the number of deaths from the flu, we could run campaigns each year to promote vaccination across the United States.